
Debug Your .NET Apps in Cursor Code Editor (with netcoredbg)
Are you struggling to debug your .NET applications in Cursor? You're not alone. I've got you covered with a simple solution using netcoredbg code debugger

Are you struggling to debug your .NET applications in Cursor? You're not alone. Microsoft's official .NET Core Debugger (vsdbg) is restricted to only Visual Studio Code, Visual Studio, and Visual Studio for Mac. But don't worry – I've got you covered with a simple solution using netcoredbg.
The Challenge
When you try to debug a .NET Core project in Cursor, you'll encounter this licensing restriction error:

This happens because Microsoft's .NET debugger (vsdbg) is officially licensed only for use with Visual Studio products. Even though Cursor is based on VS Code, it's not officially supported. However, there's an excellent alternative solution: netcoredbg
The Solution: 3 Simple Steps
Let's fix this issue with netcoredbg, a powerful open-source managed code debugger that works seamlessly with Cursor. Here's how:
1. Get the Debugger
Download netcoredbg from the official repository: netcoredbg 3.1.2-1054
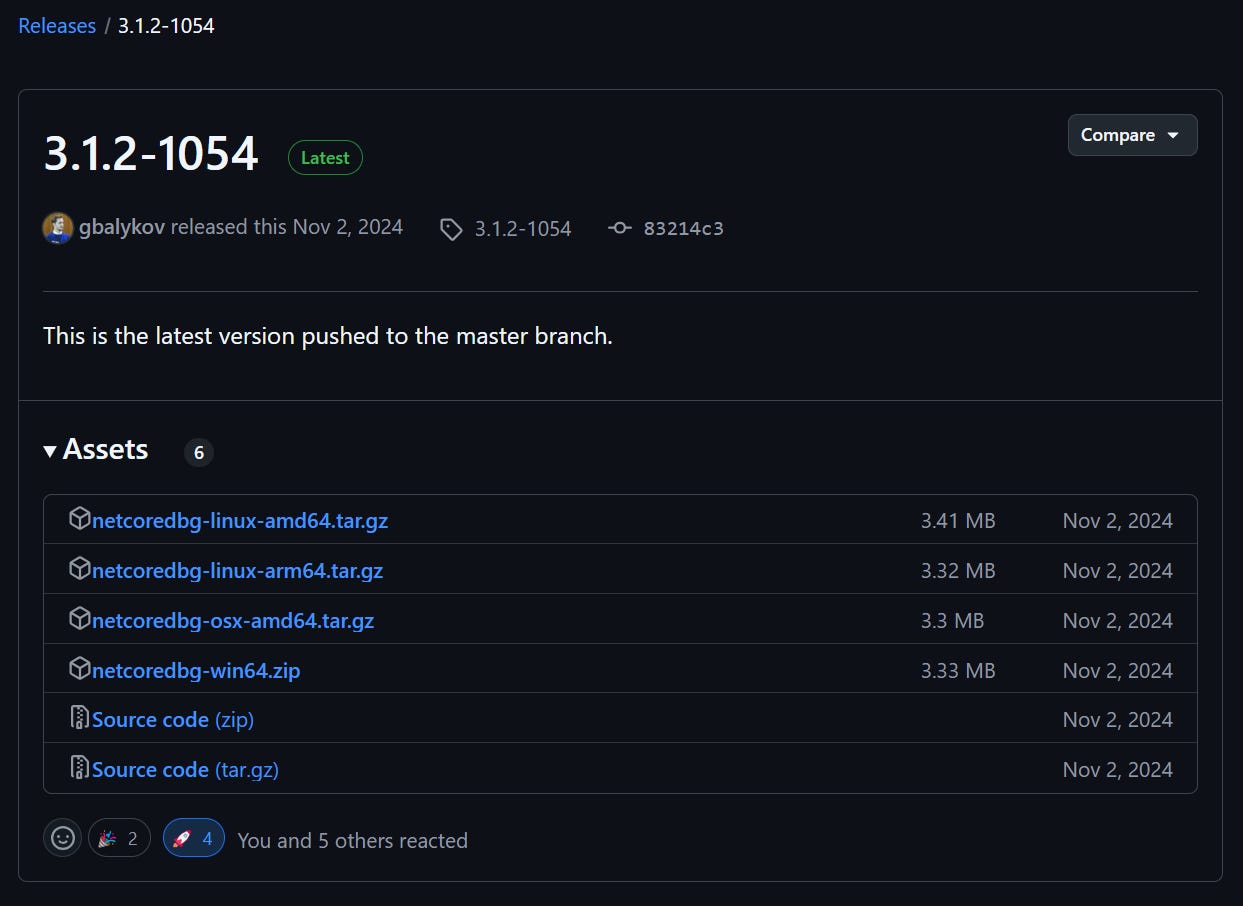
I have downloaded the latest release version (3.1.2-1054) for Windows (netcoredbg-win64.zip).macOS and Linux users should download their respective platform-specific files from the same release.
2. Extract the Files
Unzip the downloaded file to your preferred location. Inside the extracted folder, you'll find netcoredbg.exe - this is the debugger executable we'll use.
Make a note of this folder's path, as we'll need it for the debuggerPath setting in the launch.json configuration file.
3. Configure Your Project
Open your solution/project folder in Cursor and add this configuration to .vscode/launch.json:
| { | |
| "version": "0.2.0", | |
| "configurations": [ | |
| { | |
| "name": "netcoredbg", | |
| "type": "coreclr", | |
| "request": "launch", | |
| "preLaunchTask": "build", | |
| "program": "${workspaceFolder}\\bin\\Debug\\net9.0\\console-app.dll", | |
| "args": [], | |
| "cwd": "${workspaceFolder}", | |
| "pipeTransport": { | |
| "pipeCwd": "${workspaceFolder}", | |
| "pipeProgram": "powershell", | |
| "pipeArgs": ["-Command"], | |
| "debuggerPath": "C:\\Users\\w11\\Downloads\\netcoredbg-win64\\netcoredbg\\netcoredbg", | |
| "debuggerArgs": ["--interpreter=vscode"], | |
| "quoteArgs": true | |
| }, | |
| "env": { | |
| "DOTNET_ENVIRONMENT": "Development" | |
| } | |
| } | |
| ] | |
| } |
Here are the key points in this configuration:
program: Points to your debug build output - your project's .dll file - (adjust the path according to your project)debuggerPath: Path to the netcoredbg executable (update this to match your installation location)pipeProgram: Uses PowerShell for Windows environments (you can change it to 'bash' for MacOS)pipeArgs: Specifies the command argument for PowerShell (you can change it to '-c' for MacOS)
Start Debugging
Once configured, then you are free to debug your project, you only need to:
Set your breakpoints
Open the "Run and Debug View":
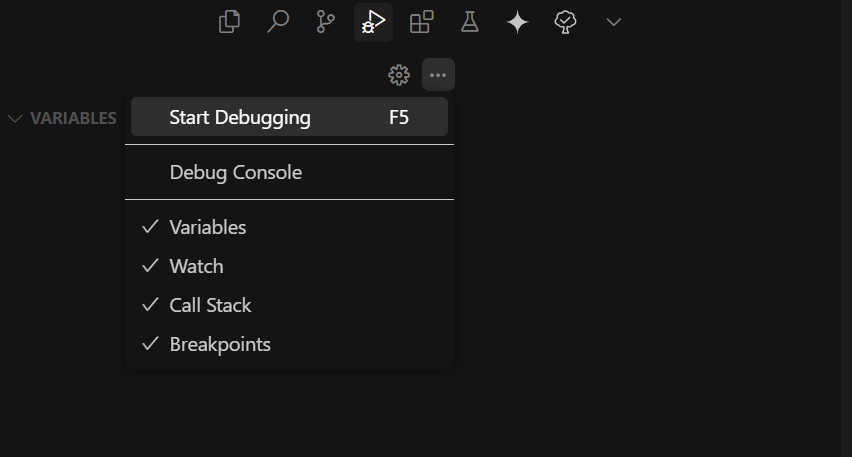
Click "Start Debugging" or press F5:
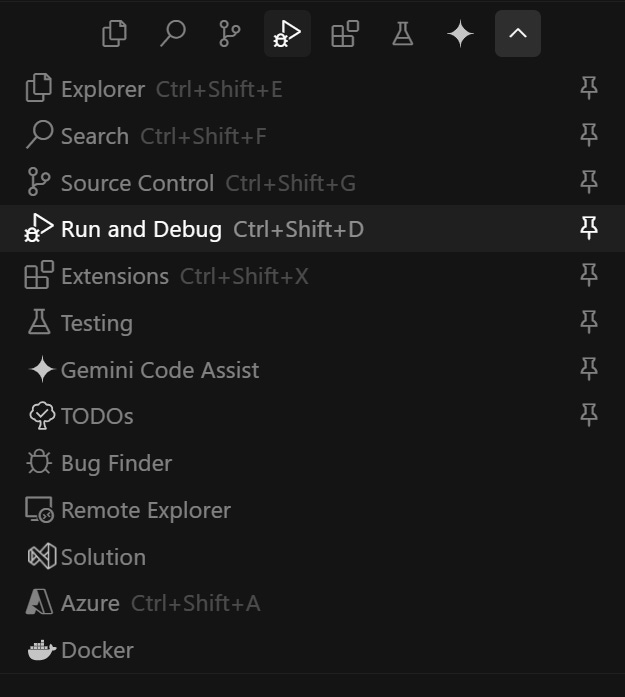
Open “Run and Debug” (CTRL + Shift + D)

After starting the debugger, here's how it looks in action:
💡 Pro Tip: Want this configuration for all your .NET projects? Add the launch configuration to your user settings (preferences > user settings) as described in this VS Code issue discussion.